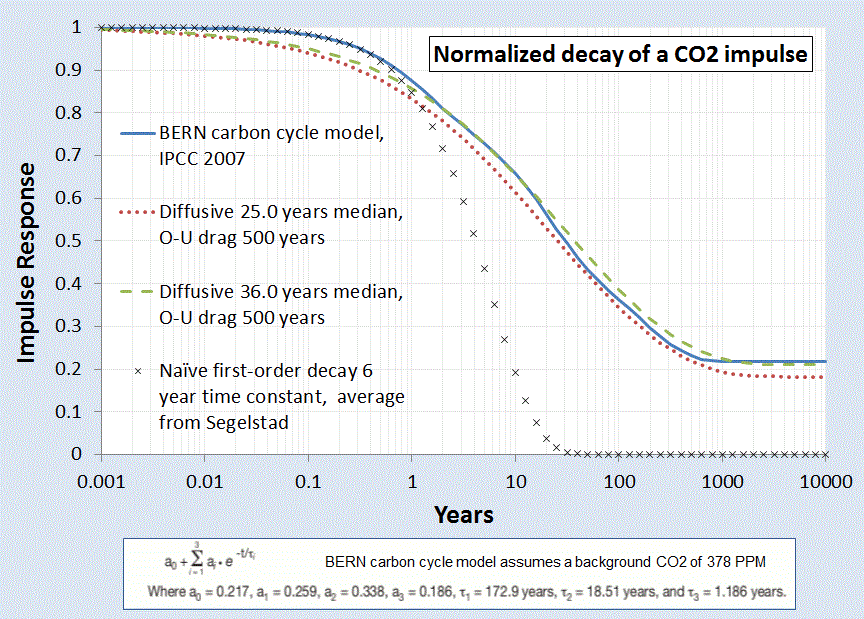
Due to its origins as a random walk process, a pure diffusion model of particles will show unbounded excursions given a long enough time duration. This is characterized by the unbounded Fickian growth law showing a dependence for a pure random walk with a single diffusivity.
In practice, the physical environment of a particle may prevent unbounded excursions. It is physically possible that the environment may impose limiting effects on the extent of motion, or that it will place some form of drag on the particle’s hopping rate the further it moves away from a mean starting value.
The rationale for this limiting process within a producing hydrofractured reservoir may arise from a barrier to diffusion beyond a certain range.
Similarly, a sequestration barrier may exist preventing CO2 from permanently exiting the active carbon cycle; this makes the fat temporal tail even fatter.
We can use the Ornstein-Uhlenbeck process to model mathematically how this pure random walk becomes bounded. The Ornstein-Uhlenbeck process has its origins in the modeling of Brownian motion with a special “reversion to the mean” property in motion excursions (specifically, it was first formulated to describe Brownian motion in the presence of drag on particle velocities, extending Einstein's work). The following expression shows the stationary marginal probability given a stochastic differential equation
which models a drag on an excursion [1]
The O-U correction is straight-forward to apply on our dispersive growth formulation, we only need apply a non-linear transformation to the time-scale.
and then apply this to a dispersive growth term such as the following:
This has the equivalent effect of appearing to slow down time at an exponential rate. This exponential rate turns out to be much faster than the Fickian growth law can sustain, so that an asymptotic limit is achieved in the diffusional growth extent.
 |
| Figure 3: The reversion to the mean process of the Ornstein-Uhlenbeck process will limit the growth of a diffusional process |
A physical model of an attractor or potential well which “tugs” on the random walker to bring it back to the mean state (see Figure below).
Algorithmic Code
The following pseudo-code snippet sets up an Ornstein-Uhlenbeck random walk model with a reversion-to-the-mean term. The diffusion term is the classical Markovian random walk transition rate. The drag term places an attractor which opposes large excursions in the term Z.
-- Ornstein-Uhlenbeck random walk = ou
ou(X1, X2, Z)
random(R)
if R < 0.5 then
Z = Z*X1 + X2
else
Z = Z*X1 - X2
end
-- This is how it gets parameterized
ou_random_walker (dX, Diffusion, Drag, Z)
X1 = exp(-2*Drag*dX)
X2 = sqrt(Diffusion*(1-exp(-2*Drag*dX))/2/Drag)
ou(X1, X2, Z)
Variance
To determine whether an Ornstein-Uhlenbeck process is apparent on a set of data, one can apply a simple multiscale variance to the result of a Z array of length N :variance(Z,N) {
L = N/2
while(L > 1) {
Sum = 0.0
for(i=1; i<N/2; i++) {
Val = Z[i] - Z[i+L]
Sum += Val * Val
}
print L “ “ sqrt(Sum/(N/2))
L = 0.95*L;
}
}
So that for a given random walk simulation, the asymptotic variance will tend to saturate at longer correlation length scales. A typical multiscale variance plot will look like those described here: http://theoilconundrum.blogspot.com/2011/11/multiscale-variance-analysis-and.html.
Autocorrelation and Spectral Representation
The autocorrelation of the Ornstein-Uhlenbeck process is, where Theta=Drag:Even though this shows a saturation level, the power spectrum still obeys a 1/S^2 fall-off.
The Orenstein-Uhlenbeck process is often referred to as red noise and the two parameters of Diffusion and Drag can be determined either from the autocorrelation function or from the PSD. For the PSD, on a log-log plot, this involves reading the peak near S=0 and then determining the shoulder of the power-law roll-off. Between these two measures, one can infer both parameter values.
References
[1]
D. Mumford and A. Desolneux, Pattern Theory: The Stochastic Analysis Of Real-World Signals. A K Peters, Ltd., 2010.


Hi WHT,
ReplyDeleteThanks for this summary.
I have a question about the NDIC Typical plot.
See e-mail.
DC