Premise: Venus has an adiabatic index γ (gamma) and a temperature lapse rate λ (lambda). Earth also has an adiabatic index and temperature lapse rate. These have been measured, and for the Earth a standard atmospheric profile has been established. The general relationship is based on thermodynamic principles but the shape of the profile diverges from simple applications of adiabatic principles. In other words, a heuristic is applied to allow it to match the empirical observations, both for Venus and Earth. See this link for more background.
Assigned Problem: Derive the adiabatic index and lapse rate for both planets, Venus and Earth, using only the planetary gravitational constant, the molar composition of atmospheric constituents, and any laws of physics that you can apply. The answer has to be right on the mark with respect to the empirically-established standards.
Caveat: Reminder that this is a tough nut to crack.
Solution: The approach to use is concise but somewhat twisty. We work along two paths, the initial path uses basic physics and equations of continuity; while the subsequent path ties the loose ends together using thermodynamic relationships which result in the familiar barometric formula and lapse rate formula. The initial assumption that we make is to start with a sphere that forms a continuum from the origin; this forms the basis of a polytrope, a useful abstraction to infer the generic properties of planetary objects.
 |
| An abstracted planetary atmosphere |
Mass Conservation
$$ \frac{dm(r)}{dr} = 4 \pi r^2 \rho $$Hydrostatic Equilibrium
$$ \frac{dP(r)}{dr} = - \rho g = - \frac{Gm(r)}{r^2}\rho $$To convert to purely thermodynamic terms, we first integrate the hydrostatic equilibrium relationship over the volume of the sphere
$$ \int_0^R \frac{dP(r)}{dr} 4 \pi r^3 dr = 4 \pi R^3 P(R) - \int_0^R 12 P(r) \pi r^2 dr $$
on the right side we have integrated by parts, and eliminate the first term as P(R) goes to zero (note: upon review, the zeroing of P(R) is an approximation if we do not let R extend to the deep pressure vacuum of space, as we recover the differential form later -- right now we just assume P(R) decreases much faster than R^3 increases ). We then reduce the second term using the mass conservation relationship, while recovering the gravitational part:
$$ - 3 \int_0^M\frac{P}{\rho}dm = -\int_0^R 4 \pi r^3 \frac{G m(r)}{r^2} dr $$
again we apply the mass conservation
$$ - 3 \int_0^M\frac{P}{\rho}dm = -\int_0^M \frac{G m(r)}{r} dm $$
The right hand side is simply the total gravitational potential energy Ω while the left side reduces to a pressure to volume relationship:
$$ - 3 \int_0^V P dV = \Omega$$
This becomes a variation of the Virial Theorem relating internal energy to potential energy.
Now we bring in the thermodynamic relationships, starting with the ideal gas law with its three independent variables.
Ideal Gas Law
$$ PV = nRT $$Gibbs Free Energy
$$ E = U - TS + PV $$Specific Heat (in terms of molecular degrees of freedom)
$$ c_p = c_v + R = (N/2 + 1) R $$On this path, we make the assertion that the Gibbs free energy will be minimized with respect to perturbations. i.e. a variational approach.
$$ dE = 0 = dU - d(TS) + d(PV) = dU - TdS - SdT + PdV + VdP $$
Noting that the system is closed with respect to entropy changes (an adiabatic or isentropic process) and substituting the ideal gas law featuring a molar gas constant for the last term.
$$ 0 = dU - SdT + PdV + VdP = dU - SdT + PdV + R_n dT$$
At constant pressure (dP=0) the temperature terms reduce to the specific heat at constant pressure:
$$ - S dT + nR dT = (c_v +R_n) dT = c_p dT $$
Rewriting the equation
$$ 0 = dU + c_p dT + P dV $$
Now we can recover the differential virial relationship derived earlier:
$$ - 3 P dV = d \Omega $$
and replace the unknown PdV term
$$ 0 = dU + c_p dT - d \Omega / 3 $$
but dU is the same potential energy term as dΩ, so
$$ 0 = 2/3 d \Omega+ c_p dT $$
Linearizing the potential gravitational energy change with respect to radius
$$ 0 = \frac{2 m g}{3} dr + c_p dT $$
Rearranging this term we have derived the lapse formula
$$ \frac{dT}{dr} = - \frac{mg}{3/2 c_p} $$
Reducing this in terms of the ideal gas constant and molecular degrees of freedom N
$$ \frac{dT}{dr} = - \frac{mg}{3/2 (N/2+1) R_n} $$
We still need to derive the adiabatic index, by coupling the lapse rate formula back to the hydrostatic equilibrium formulation.
Recall that the perfect adiabatic relationship (the Poisson's equation result describing the potential temperature) does not adequately describe a standard atmosphere -- being 50% off in lapse rate -- and so we must use a more general polytropic process approach.
Combining the Mass Conservation with the Hydrostatic Equilibrium:
$$ \frac{1}{r^2} \frac{d}{dr} (\frac{r^2}{\rho} \frac{dP}{dr}) = -4 \pi G \rho $$
if we make the substitution
$$ \rho = \rho_c \theta^n $$
where n is the polytropic index. In terms of pressure via the ideal gas law
$$ P = P_c \theta^{n+1} $$
if we scale r as the dimensionless ξ :
$$ \frac{1}{\xi^2} \frac{d}{d\xi} (\frac{\xi^2}{\rho} \frac{dP}{d\xi}) = - \theta^n $$
This formulation is known as the Lane-Emden equation and is notable for resolving to a polytropic term. A solution for n=5 is
$$ \theta = ({1 + \xi^2/3})^{-1/2} $$
We now have a link to the polytropic process equation
$$ P V^\gamma = {constant} $$
and
$$ P^{1-\gamma} T^{\gamma} = {constant} $$
or
$$ P = P_0 (\frac{T}{T_0})^{\frac{\gamma}{1-\gamma}} $$
Tieing together the loose ends, we take our lapse rate gradient
$$ \frac{dT}{dr} = \frac{mg}{3/2 (N/2+1) R} $$
and convert that into an altitude profile, where r = z
$$ T = T_0 (1 - \frac{z}{f z_0}) $$
where
$$ z_0 = \frac{R T_0}{m g} $$
and
$$ f = 3/2 (1 + N/2) $$
and the temperature gradient, aka lapse rate
$$ \lambda= \frac{m g}{ 3/2 (1 + N/2) R } $$
To generate a polytropic process equation from this, we merely have to raise the lapse rate to a power, so that we recreate the power law version of the barometric formula:
$$ P = P_0 (1 - \frac{z}{f z_0})^f $$
which essentially reduces to Poisson's equation on substitution:
$$ P = P_0 (T/T_0)^f $$
where the equivalent adiabatic exponent is
$$ f = \frac{\gamma}{1-\gamma} $$
Now we have both the lapse rate, barometric formula, and Poisson's equation derived based only on the gravitational constant g, the gas law constant R, the average molar molecular weight of the atmospheric constituents m, and the average degrees of freedom N.
Answer: Now we want to check the results against the observed values for the two planets
Parameters
| Object | Main Gas | N | m | g |
| Earth | N2, O2 | 5 | 28.96 | 9.807 |
| Venus | CO2 | 6 | 43.44 | 8.87 |
| Object | Lapse Rate | observed | f | observed |
| Earth | 6.506 C/km | 6.5 | 21/4 | 5.25 |
| Venus | 7.72 | 7.72 |
6 | 6 |
All the numbers are spot on with respect to the empirical data recorded for both Earth and Venus, with supporting figures available here.
-------
Criticisms welcome as I have not run across anything like this derivation to explain the Earth's standard atmosphere profile nor the stable Venus data (not to mention the less stable Martian atmosphere). The other big outer planets filled with hydrogen are still an issue, as they seem to follow the conventional adiabatic profile, according to the few charts I have access to. The moon of Saturn, Titan, is an exception as it has a nitrogen atmosphere with methane as a greenhouse gas.
BTW, this post is definitely not dedicated to Ferenc Miskolczi. Please shoot me if I ever drift in that direction. It's a tough slog laying everything out methodically but worthwhile in the long run.
Added
 |
| Added Fig 1 : Lapse Rate on Earth versus Latitude. From
D. J. Lorenz and E. T. DeWeaver, “Tropopause height and zonal wind response to global warming in the IPCC scenario integrations,” Journal of Geophysical Research: Atmospheres (1984–2012), vol. 112, no. D10, 2007.
|
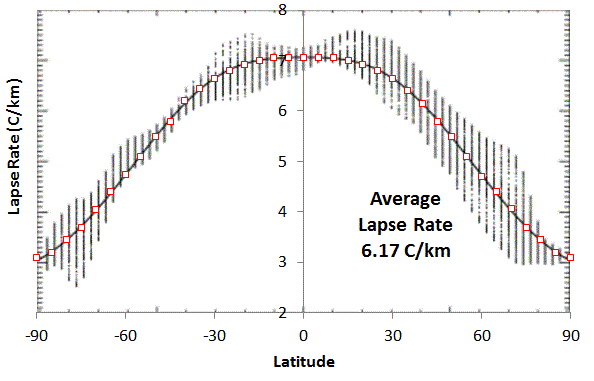 |
| Added Fig 2 : Lapse Rate on Earth versus Latitude. The average was calculated by integrating with effective cross-sectional area weighting of (sin(Latitude+2.5)-sin(Latitude-2.5)) . Adapted from
J.
P. Syvitski, S. D. Peckham, R. Hilberman, and T. Mulder, “Predicting
the terrestrial flux of sediment to the global ocean: a planetary
perspective,” Sedimentary Geology, vol. 162, no. 1, pp. 5–24, 2003.
|
 |
| Added Fig 3: This study also suggests an average lapse rate of 6.1C/km over the northern hemisphere.
I. Mokhov and M. Akperov, “Tropospheric lapse rate and its relation to surface temperature from reanalysis data,” Izvestiya, Atmospheric and Oceanic Physics, vol. 42, no. 4, pp. 430–438, 2006.
|
If we go back and look at the hydrostatic relation derived earlier, we see an interesting identity:
$$ - 3 \int_0^M\frac{P}{\rho}dm = -\int_0^M \frac{G M}{r} dm $$
If I pull out the differential from the integral
$$ 3 \frac{P}{\rho} = \frac{G M}{r} $$
and then realize that the left-hand side is just the Ideal Gas law
$$ 3RT/m = \frac{G M}{r} $$
This is internal energy due to gravitational potential energy.
If we take the derivative with respect to r, or altitude:
$$ 3R \frac{dT}{dr} = - \frac{G M m}{r^2} $$
The right side is just the gravitational force on an average particle. So we essentially can derive a lapse rate directly:
$$ \frac{dT}{dr} = - \frac{g m}{3 R} $$
This will generate a linear lapse rate profile of temperature that decreases with increasing altitude. Note however that this does not depend on the specific heat of the constituent atmospheric molecules. That is not surprising since it only uses the Ideal Gas law, with no application of the variational Gibbs Free Energy approach used earlier.
What this gives us is a universal lapse rate that does not depend on the specific heat capacity of the constituent gases, only the mean molar molecular weight, m. This is of course an interesting turn of events in that it could explain the highly linear lapse profile of Venus. However, plugging in numbers for the gravity of Venus and the mean molecular weight (CO2 plus trace gases), we get a lapse rate that is precisely twice that which is observed.
The "obvious" temptation is to suggest that half of the value of this derived hydrodynamic lapse rate would position it as the mean of the lapse rate gradient and an isothermal lapse rate (i.e. slope of zero).
$$ \frac{dT}{dr} = - \frac{g m}{6 R} $$
The rationale for this is that most of the planetary atmospheres are not any kind of equilibrium with energy flow and are constantly swinging between an insolating phase during daylight hours, and then a outward radiating phase at night. The uncertainty is essentially describing fluctuations between when an atmosphere is isothermal (little change of temperature with altitude producing a MaxEnt outcome in distribution of pressures, leading to the classic barometric formula) or isentropic (where no heat is exchanged with the surroundings, but the temperature can vary as rapid convection occurs).
In keeping with the Bayesian decision making, the uncertainty is reflected by equal an weighting between isothermal (zero lapse rate gradient) and an isentropic (adiabatic derivation shown). This puts the mean lapse rate at half the isentropic value. For Earth, the value of g*m/3R is 11.4 C/km. Half of this value is 5.7 C/km, which is a value closer to actual mean value than the US Standard Atmosphere of 6.5 C/km
J. Levine, The Photochemistry of Atmospheres. Elsevier Science, 1985.
"The value chosen for the convective adjustment also influences the calculated surface temperature. In lower latitudes, the actual temperature decrease with height approximates the moist adiabatic rate. Convection transports H2O to higher elevations where condensation occurs, releasing latent heat to the atmosphere; this lapse rate, although variable, has an average annual value of 5.7 K/km in the troposphere. In mid and high latitudes, the actual lapse rates are more stable; the vertical temperature profile is controlled by eddies that are driven by horizontal temperature gradients and by topography. These so-called baroclinic processes produce an average lapse rate of 5.2 K/km - It is interesting to note that most radiative convective models have used a lapse rate of 6.5 K km - which was based on date sets extending back to 1933. We know now that a better hemispherical annual lapse rate is closer to 5.2 K/km, although there may be significant seasonal variations. "
References
[1]
“Polytropes.” [Online]. Available: http://mintaka.sdsu.edu/GF/explain/thermal/polytropes.html. [Accessed: 19-May-2013].
[2]
B. Davies, “Stars Lecture.” [Online]. Available: http://www.ast.cam.ac.uk/~bdavies/Stars2 . [Accessed: 28-May-2013].
Even More Recent Research
A number of Chinese academics [3,4] are attacking the polytropic atmosphere problem from an angle that I hinted at in the original Standard Atmosphere Model and Uncertainty in Entropy post. The gist of their approach is to assume that the atmosphere is not under thermodynamic equilibrium (which it isn't as it continuously exchanges heat with the sun and outer space in a stationary steady-state) and therefore use some ideas of non-extensible thermodynamics. Specifically they invoke Tsallis entropy and a generalized Maxwell-Boltzmann distribution to model the behavioral move toward an equilibrium. This is all in the context of self-gravitational systems, which is the theme of this post. Why I think it is intriguing, is that they seem to tie the entropy considerations together with the polytropic process and arrive at some very simple relations (at least they appear somewhat simple to me).
In the non-extensive entropy approach, the original Maxwell-Boltzmann (MB) exponential velocity distribution is replaced with the Tsallis-derived generalized distribution -- which looks like the following power-law equation:
$$ f_q(v)=n_q B_q (\frac{m}{2 \pi k T})^{3/2} (1-(1-q) \frac{m v^2}{2 k T})^{\frac{1}{1-q}}$$
The so-called q-factor is a non-extensivity parameter which indicates how much the distribution deviates from MB statistics. As q approaches 1, the expression gradually trasforms into the familiar MB exponentially damped v^2 profile.
When q is slightly less than 1, all the thermodynamic gas equations change slightly in character. In particular, the scientist Du postulated that the lapse rate follows the familiar linear profile, but scaled by the (1-q) factor:
$$ \frac{dT}{dr} = \frac{(1-q)g m}{R} $$
Note that this again has no dependence on the specific heat of the constituent gases, and only assumes an average molecular weight. If q=7/6 or Q = 1-q = -1/6, we can model the f=6 lapse rate curve that we fit to earlier.
There is nothing special about the value of f=6 other than the claim that this polytropic exponent is on the borderline for maintaining a self-gravitational system [5].
Note that as q approaches unity, the thermodynamic equilibrium value, the lapse rate goes to zero, which is of course the maximum entropy condition of uniform temperature.
The Tsallis entropy approach is suspiciously close to solving the problem of the polytropic standard atmosphere. Read Zheng's paper for their take [3] and also Plastino [6].
The cut-off in the polytropic distribution (5) is an example of what is known, within the field of non extensive thermostatistics, as “Tsallis cut-off prescription”, which affects the q-maximum entropy distributions when q < 1. In the case of stellar polytropic distributions this cut-off arises naturally, and has a clear physical meaning. The cut-off corresponds, for each value of the radial coordinate r, to the corresponding gravitational escape velocity.This has implications for the derivation of the homework problem that we solved at the top of this post, where we eliminated one term of the integration-by-parts solution. Obviously, the generalized MB formulation does have a limit to the velocity of a gas particle in comparison to the classical MB view. The tail in the statistics is actually cut-off as velocities greater than a certain value are not allowed, depending on the value of q. As q approaches unity, the velocities allowed (i.e. escape velocity) approach infinity.
As Plastino states [6]:
Polytropic distributions happen to exhibit the form of q-MaxEnt distributions, that is, they constitute distribution functions in the (x,v) space that maximize the entropic functional Sq under the natural constraints imposed by the conservation of mass and energy.The enduring question is does this describe our atmosphere adequately enough? Zheng and company certainly open it up to another interpretation.
[3]
Y. Zheng, W. Luo, Q. Li, and J. Li, “The polytropic index and adiabatic limit: Another interpretation to the convection stability criterion,” EPL (Europhysics Letters), vol. 102, no. 1, p. 10007, 2013.
[4]
Z. Liu, L. Guo, and J. Du, “Nonextensivity and the q-distribution of a relativistic gas under an external electromagnetic field,” Chinese Science Bulletin, vol. 56, no. 34, pp. 3689–3692, Dec. 2011.
[5]
M. V. Medvedev and G. Rybicki, “The Structure of Self-gravitating Polytropic Systems with n around 5,” The Astrophysical Journal, vol. 555, no. 2, p. 863, 2001.
[6]
A. Plastino, “Sq entropy and selfgravitating systems,” europhysics news, vol. 36, no. 6, pp. 208–210, 2005.

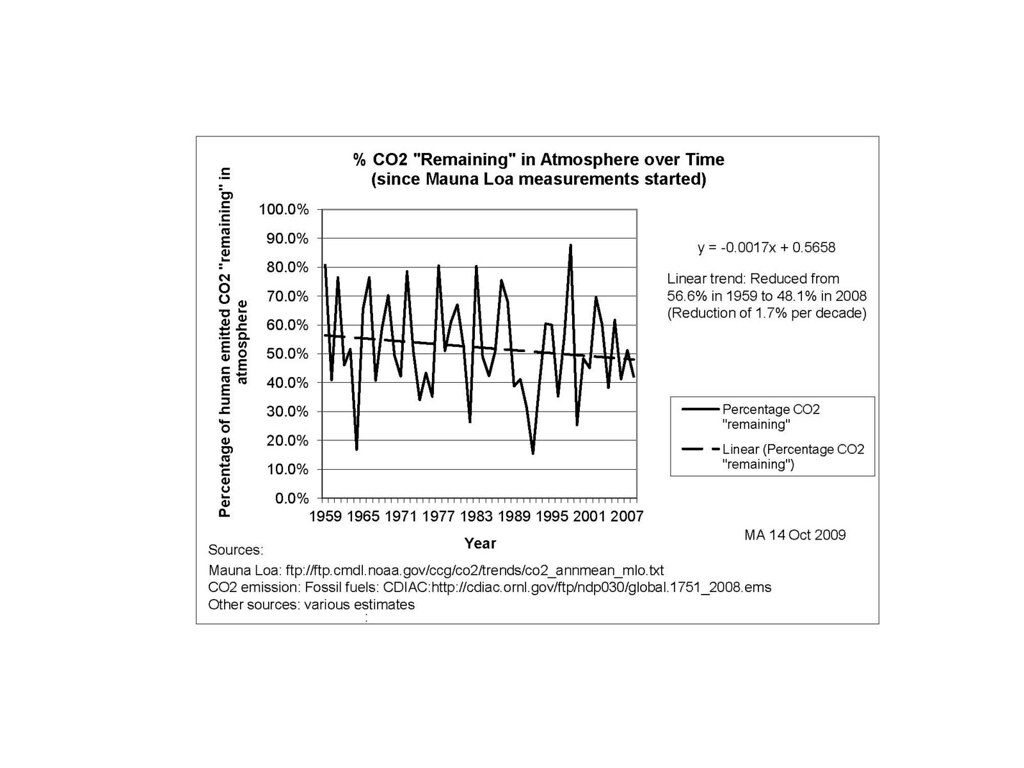


On the right is the model with the incorporation of a temperature-dependent outgassed fraction. In this case the model is more noisy than the data, as it includes outgassing of CO2 depending on the global temperature for that year. Since the temperature is noisy, the CO2 fraction picks up all of that noise. Still, the airborne fraction shows a small yet perceptible decline, and the model matches the data well, especially in recent years where the temperature fluctuations are reduced.
Amazing that over 50 years, the mean fraction has not varied much from 55%. That has a lot to do with the math of diffusional physics. Essentially a random walk moving into and out of sequestering sites is a 50/50 proposition. That’s the way to intuit the behavior, but the math really does the heavy lifting in predicting the fraction sequestered out.
It looks like the theory matches the data once again. The skeptics provide a knee-jerk view that this behavior is not well understood, but not having done the analysis themselves, they lose out -- the skeptic meme is simply one of further propagating fear, uncertainty, and doubt (FUD) without concern for the underlying science.