Tamino's post is comprehensive, but I wanted to check to see if I could extract any signal from the data myself.
The data is in the upper right of the following figure, and the FFT-based power spectral density (PSD) is in the lower left.
 |
| FFT PSD lower left, Data upper right |
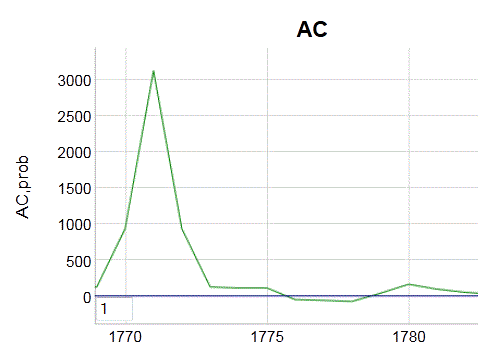
The PSD is nondescript with a red noise envelope shown by the solid line. Red noise is the embodiment of the Ornstein-Uhlenbeck process. This red noise shows very short correlation, at most a lag of one or two time units, as shown in the autocorrelation below.
 |
| Autocorrelation function, centered at 1/2 time series length |
Hard pressed to find any real signal in such a time series. A simulation of Ornstein-Uhlenbeck red noise is shown to the left below, with a slice of the Greenland data to the right.
 |
| Ornstein-Uhlenbeck red noise time series (left) and slice of data (right) |
References
[1]
P. Chylek, C. Folland, L. Frankcombe, H. Dijkstra, G. Lesins, and M. Dubey, “Greenland ice core evidence for spatial and temporal variability of the Atlantic Multidecadal Oscillation,” Geophysical Research Letters, vol. 39, no. 9, 2012.
No comments:
Post a Comment