So I am taking Heading Out to task for a poor scientific argument and making some real fundamental mistakes while trying to apply the HL technique. See the short TOD post called Tech Talk - California Oil and Hubbert Linearization for some background. The HL portion of the curve is the straight line in the curve below; this line intercepts at a point at which you can estimate the ultimately recoverable cumulative oil. (These were originally plotted by Laherrere).
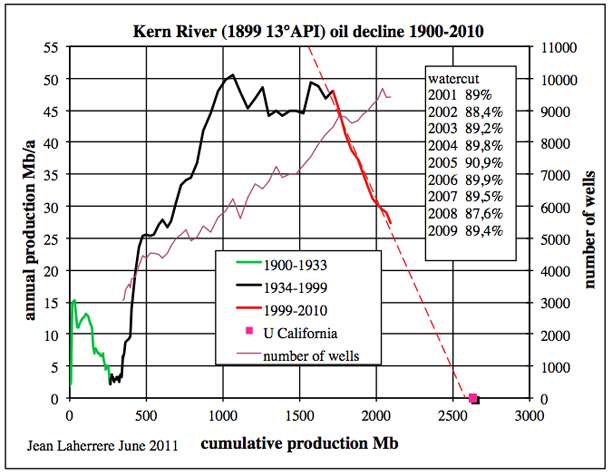
First note that the "Hubbert Linearization" curves as plotted here is done as Q (cumulative) on the x-axis and P (yearly) on the y-axis. This is not the conventional Hubbert Linearization as applied to a Hubbert Logistic curve. For that curve, the analysts usually plot P/Q (not just P) on the y-axis, which effectively linearizes the equation quoted in the box (i.e. "Stuart's explanation").
(from the TOD post http://www.theoildrum.com/node/8100)
So how are these plots derived?
This is a topic that has been covered almost since the time that The Oil Drum was founded (back in March 2005), since it was in May of that year that Jean (Laherrere) published a paper describing how to “Forecast Production from Discovery.” (His pioneering work, internationally recognized in this field, did not start with this. For example, he co-authored with Colin Campbell the Scientific American article on “The End of Cheap Oil” in 1998.)
Within the pages of TOD Stuart Staniford had briefly explained it while comparing different methods of estimating future production back in September 2005, with a follow-on post looking at specific examples where it might be applied.
The technique derives from a process known as Hubbert Linearization (after King Hubbert, who is largely remembered for predicting the date of peak oil production in the US before it happened). Examining the data from oil production over time, Dr Hubbert postulated that it followed a logistic curve, which as Stuart pointed out, is an accepted model of how exponential growth occurs in a system that is of a certain finite size. It has been used since its original discovery in 1838.
The mathematics of the equation are fairly straightforward, and for consistency I am going to quote Stuart’s explanation:
It's pretty obvious that this change of P vs P/Q makes a huge difference to the interpretation of the plotted curve.
So let me provide the actual mechanics involved.
As a simple premise, consider that one of the most common models of a single field depletion is what one would call a proportional drawdown. This essentially says that the amount you can draw per unit time (the rate) is approximately proportional to the amount left.
Mathematically this relation is expressed as dQ/dt = k(Q0-Q)
which when solved with initial conditions gives the damped exponential:
Q = Q0*(1-exp(-k*t))where Q0 is the maximum cumulative. This is a basic example of the law of diminishing
returns and occurs in many other natural phenomenon.
Annual production for this curve is simply the slope of the Q curve:
P(t) = dQ/dtand rewrite it like this:
P = Q0*k*(1-Q/Q0)
Lo and behold, this is clearly a linearized equation as well. Yet, this is not based on a
symmetric Hubbert curve, as the damped exponential is not even close to having the classic peaked shape.
Now, if the parameter k was to increase in direct proportion to Q, we would come up with the Logistic peak, but this would have to be so coincidental and contrived as to be completely absurd. And if this Logistic increase was introduced to these California data sets , then it would make a complete mess of the Laherrere curves as plotted -- they would no longer show linearity with the choice of axes!
Now you can also see how the earlier parts of the plot can be effected. Notice that
the drawdown rate, k, or the ultimate Q0, could potentially change over time. The Kern was one of those cases that benefited from technical advancements over time and ultimately held a large secondary reserve of very heavy oil that was exploited many years after it was originally discovered.
Therefore, everything that is said in this particular TOD post is explained by a much simpler interpretation than the brain-dead Hubbert Logistic. This has nothing to do with HL, and everything to do with first-order drawdown dynamics from a single field and some logical deductions as to what is happening.
All in all, this is another completely flawed analysis published in The Oil Drum. Heading Out included all this useless info on Hubbert Linearization without realizing it had little to do with the problem at hand.
I am now of the opinion that the charter of The Oil Drum doesn't involve wanting to do the math correctly, even if it approaches the trivial. Most of the TOD posters have this long-standing infatuation with heuristics and I have noticed that it always comes back to bite them when they try to "prove" something.
I would advise them to adapt to some current mathematical practices, like say calculus, logic, and probabilities. The old guard of Hubbert and Deffeyes had some insight but clearly didn't have all the answers. Some of the other analysts like Staniford have essentially lead us down blind alleys. Robert Rapier does indeed have it correct in suggesting we drop HL as "The Way" of proving anything. Ultimately this key-post was a case of completely misapplying the technique and then claiming that it serves as an example of where HL actually works.
It does not, however, always apply, and Robert Rapier has explained, in two posts (here, and here) why he has concerns about using the technique. But in terms of giving a ballpark for production (and recognizing that there are always new discoveries and inventions that can be, as they say, game changers) the technique has considerable support. And the consistency with which the Californian fields are following the predictions provide evidence for such an opinion.Here is the disagreement:
The problem in the TOD piece is that Heading Out thinks he is showing Hubbert Linearization on Laherere's plots whereas he is actually only showing the equivalent of a proportional drawdown from a reservoir.
Here is the important premise:
Consider that someone has the good fortune to earn their income from a trust fund. But the terms of the trust fund are that you can only draw from the trust a percentage per year, k, from what is remaining in the fund. Say that the trust fund starts with a quantity Q0, then the amount you would be expected to draw from it yearly is P, which is the time rate of change of the amount left.
Here is the correct solution:
Mathematically, this gets expressed as
P = dQ/dt = k/100*(Q0-Q)I don't have to go any further than this because the equation above is all that Heading Out is plotting. The total cumulative amount is the x-axis and the proportional amount is the y-axis. The trust fund analogizes to the oil reservoir and the production draw-down is proportional to the amount of oil remaining. The fit turns out to match proportional draw-down very well. However, this has nothing to do with the Hubbert peak or with Hubbert Linearization of the peak.
Here is the mistake:
Heading Out made the mistake in thinking that he was plotting the completely different
dQ/dt = k*Q*(Q0-Q)which is the "classic" Hubbert Peak formulation. But that is not what he plotted as the extra multiplicative factor Q is not shown on either of Laherrere's axis. If he plotted it this way, the line through the data would no longer be straight, and Hubbert Linearization would FAIL :(
Here are the implications:
One of the hardest things in technical discussions is to demonstrate how someone did some calculation wrong. You can only try to speculate on why they chose their argument leading to the bad result. And then you run the risk of over-analyzing the situation and confusing someone who can't tell the difference between what is wrong or what is right. School teachers learn how to this endlessly with their students and turn out to be among the most patient people in the world. In the end, I lose patience and just say that the application of Hubbert Linearization that Heading Out performed is WRONG.
What this means is that Heading Out needs to retract that article and start from scratch. You can't put lipstick on a pig, or polish a turd. I wouldn't want to go beyond this and talk at all about how Hubbert Linearization is useful, because this study of California oil production is a case where it is clearly NOT useful. So sorry to say it doesn't work the way that Heading Out is thinking, and what I have written both in this post and in the past substantiates Rapier's views.
For me, these TOD posts are easy to respond to because I only have to refer to what I have written before, where I have tried to tie all the loose ends together:

aka "The Oil Conunundrum"
I stopped posting at my old blog because after I put the book together, I realized that it serves as kind of an archival record of what went into the book. I thought working scientific problems out in the open with some fresh thoughts along with real-time contributions from commenters could lead to a better analysis. We'll see how it turns out. In the meantime, if people have ideas of new places to post on these topics, I would be interested, otherwise I will continue to post here to combat what I think is intellectual laziness amongst the peak oil crowd.