At one of the climate blogs, a gang of climate change skeptics tried to convince their fellow skeptics that the sea level rise had turned the tide (so to speak) and started to decrease. The skeptic Rob (Ringo) Starkey kindly provided the data and pointed to a recent dip in the data:
http://sealevel.colorado.edu/files/2013_rel3/sl_ns_global.txtBDD smelled something fishy and pointed out that these are at best seasonal dips and labelled it rubbish, and reasoned that they were likely trying to save face over some other wrong they had committed. What I usually find is that the more that the fake skeptics howl about something, the more likely that there are creepy crawly things they are trying to hide under the rock. Well, in this case the sea-level rise data that Ringo pointed us to shows a clear 2 month oscillation in the time series. Sorry Ringo, "steven", and Captain Tuna, easy enough to put a 2-month notch filter in the time series data and just look at how much smoother it gets.
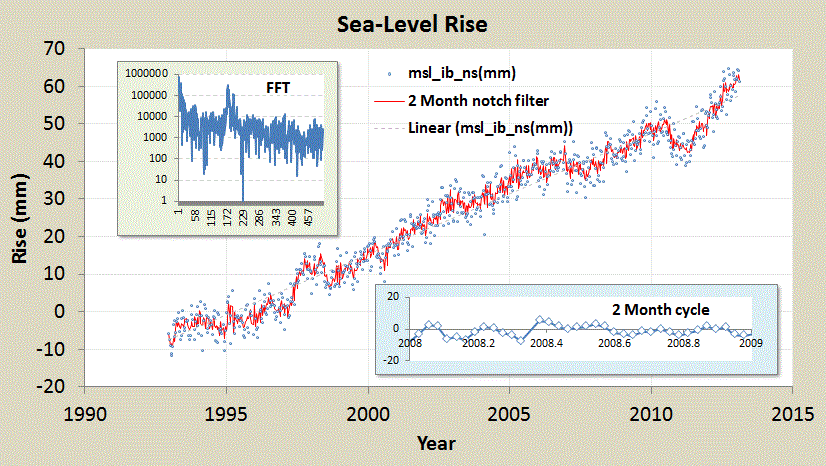 | |
| Figure 1 : Upper left inset is a FFT of the detrended sea-level rise data shown in the lower right inset. A clear two month cycle shows up in the FFT and by eyeballing any yearly interval. After performing a simple 2 month notch filter on the data and adding back in the trend, the red curve shows significant noise reduction. |
The oscillation is possibly identified as a meridional current fluctuation of 2 months located in the Pacific described by this Woods Hole investigation: "Air-Sea Interaction in the Eastern Tropical Pacific ITCZ/Cold Tongue Complex" page. It also is described by a member of the same team in this PhD thesis [1] :
"The period of the oscillations can be seen to be about two months from October 1997 to June 1998, and the oscillations rapidly intensify during the first few months of 1998. The amplitude of the oscillations approximately doubles between December 1997 and February 1998, and it doubles again between February and April 1998. At its peak strength in April 1998, the signal is associated with nearly a 7 cm peak-to-peak change in the thickness of the upper 110 m of the water column. "One can see the peaks in late 1997 and early 1998 from Figure 1, enlarged and highlighted below
 |
| Figure 2: Identification of water column thickness increase |
References
[1]
J. Farrar, “Air-sea interaction at contrasting sites in the Eastern Tropical Pacific : mesoscale variability and atmospheric convection at 10°N,” PhD Thesis, MIT, Woods Hole, 2007.
http://dspace.mit.edu/handle/1721.1/39009
http://dspace.mit.edu/handle/1721.1/39009
EDIT
I noticed that the sea level research group at U of Colorado had already placed a 60 day (2 month) smoothing filter when they display the data (see figure below). This is similar to the 2-point notch filter that I use, which I set specifically to pair up data points so that they are out-of-phase at the 30-day mark. A general smoothing filter will accomplish the same thing but will also filter out shorter periods in the data set.
 |
http://sealevel.colorado.edu/content/2013rel3-global-mean-sea-level-time-series-seasonal-signals-removed |
No comments:
Post a Comment