This is updated information from 2005 and 2008 concerning projections of North Sea UK Oil production.
The following Figure 1 is a screenshot of an interactive oil shock model session, which is part of a larger environmental modeling framework.
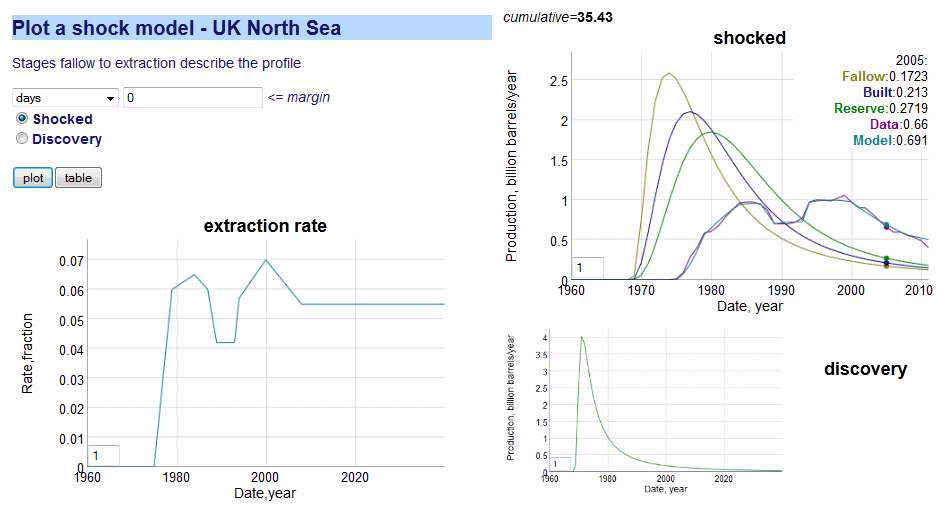 |
| Figure 1: Shock Model for UK North Sea Oil. The oil production output is the profile with two humps, with model and data shown together. Extraction rate applied to the extrapolated reserves gives the production. |
The discovery curve follows a dispersive profile which allows us to project future availability along a declining tail. The extraction perturbations show a temporary glitch corresponding to the Piper Alpha platform disaster, but otherwise shows around a 6% extraction rate from reserves over the years. This rate isn't expected to move upwards much (contrary to my previous projection) because any increase in technological advancements will be compensated by fields that are tougher to extract from.
Also included in the interactive session is an ability to pull up individual fields (all part of a semantic web server), shown in Figure 2. The "Forties" oil field is one of the earliest discoveries and commenced production at the start of the UK North Sea era.
 |
| Figure 2: Individual plot of a UK platform, the "Forties" oil field. The downward glitch at the end is a -1 value indicating production values are not yet available for that year. |
 |
| Figure 3: PM Margaret Thatcher was at the right place at the right time. Leader of the conservative party starting in 1975, and then became Prime Minister in 1979, she reigned during the huge buildup in oil production, which was temporarily halted by the Piper Alpha explosion in 1988. |
The Piper production halted for several years and pulled down other platform production levels as better maintenance policies were instituted. This had the unintended benefit of extending the UK production level before the eventual decline set in.
 |
| Figure 4: Piper Alpha oil production halted for several years |
Updates
Feedback from others
http://www.theoildrum.com/node/9946#comment-958176
http://transportblog.co.nz/2013/04/12/oil-dependancy-and-the-wealth-of-nations/
Sources
http://www.worldreview.info/content/uk-north-sea-oil-and-gas-resurgence-activity
Interesting that someone posted this title after I did my post
ReplyDeletehttp://conservativehome.blogs.com/the-deep-end/2013/05/the-rise-and-fall-and-rise-again-of-north-sea-oil-to-be-followed-by-another-fall.html
"The rise and fall and rise again of North Sea oil (to be followed by another fall)"
2013 stats showed 820 million barrels of oil
ReplyDeletehttp://oilprice.com/Energy/Energy-General/North-Sea-Spotlight-What-Scottish-Independence-Will-Mean-for-UK-Oil.html