(see this more recent derivation as well)
An isentropic process will not exchange energy with the environment and therefore will maintain a constant entropy (also describing an adiabatic process).
If it was isothermal, all altitudes would be at the same temperature, realizing a disordered equilibrium state.This is maximum entropy as all the vertical layers are completely mixed.
Yet, when convective buoyancy results from evaporation, energy is exchanged up and down the column. And when green-house gases change the radiative properties of the layers, the temperature will also change to some degree.
So, how would we naively estimate what the standard atmospheric profile of such a disordered state would be? The standard approach is to assume maximum uncertainty between the extremes of isentropic and isothermal conditions. This is essentially a mean estimate of half the entropy of the isothermal state, and a realization of Jaynes recommendation to assume maximum ignorance when confronted with the unknown.
We start with the differential representation
$$dH = V dp + T ds $$
Add in the ideal gas law assuming the universal gas constant and one mole.
$$ pv = RT $$
Add in change in enthalpy applying the specific heat capacity of air (at constant pressure).
$$dH = c_p dT$$
Substitute the above two into the first equation:
$$c_p dT = \frac{RT}{p} dp + T ds $$
Rearrange in integrable form
$$c_p \frac{dT}{T} = \frac{R}{p} dp + ds $$
Integrate between the boundary conditions
$$c_p \cdot ln(\frac{T_1}{T_0} ) = R \cdot ln(\frac{p_1}{p_0}) + \Delta s $$
The average delta entropy change (loss) from a low temperature state to a high temperature state is:
$$ \Delta s = - \frac{1}{2} c_p \cdot ln(\frac{T_1}{T_0} ) $$
The factor of 1/2 is critical because it represents an average entropy between zero entropy change and maximum entropy change. So this is halfway in between an isentropic and an isothermal process (somewhere in the continuum of a polytropic process, categorized as a quasi-adiabatic process 1 < n < γ, where n is the polytropic index and γ is known as the adiabatic index or isentropic expansion factor or heat capacity ratio).
Added Note: The loss or dispersion of energy is likely due to the molecules having to fight gravity to achieve a MaxEnt distribution as per the barometric formula. The average loss is half the potential energy of the barometric height (an average troposphere height) and this is reflected as half again of the dH kinetic heat term ½ CpΔT = mg ½ ΔZ. This is a hypothesis to quantify the dispersed energy defined by the hidden states of ΔS.Substituting and rearranging:
$$ \frac{3}{2} c_p \cdot ln(\frac{T_1}{T_0} ) = R \cdot ln(\frac{p_1}{p_0}) $$
which leads to the representation
$$ T_1 = T_0 \cdot (\frac{p_1}{p_0})^{R/{1.5 c_p}} $$
which only differs from the adiabatic process (below) in its modified power law (since n<γ it is a quasi-adiabatic process):
$$ T_1 = T_0 \cdot (\frac{p_1}{p_0})^{R/c_p} $$
The Standard Atmosphere model represents a typical barometric profile
The "Standard Atmosphere" is a hypothetical vertical distribution of atmospheric properties which, by international agreement, is roughly representative of year-round, mid-latitude conditions. Typical usages include altimeter calibrations and aircraft design and performance calculations. It should be recognized that actual conditions may vary considerably from this standard.
The most recent definition is the "US Standard Atmosphere, 1976" developed jointly by NOAA, NASA, and the USAF. It is an idealized, steady state representation of the earth's atmosphere from the surface to 1000 km, as it is assumed to exist during a period of moderate solar activity. The 1976 model is identical with the earlier 1962 standard up to 51 km, and with the International Civil Aviation Organization (ICAO) standard up to 32 km.
Using R = 287 J/K/kg, cp =1004 J/K/kg, we fit the equation that we derived above to the US Standard Atmosphere data set in the figure below:
 |
| Standard Atmosphere Model (circles) compared to average entropy derivation (line) |
The correlation coefficient between the standard atmospheric model and the derived expression is very close to one, which means that the two models likely converge to the same reduced form.
How was the US Standard Atmosphere 1975 model chosen? Was this empirically derived from measured temperature gradients (i.e. lapse rates) and barometric pressure profiles? Or was it estimated in an equivalent fashion to that derived here?
The globally averaged temperature gradient is 6.5 C/km, which is exactly g/(1.5cp). Compare this to the adiabatic gradient of 9.8 C/km = g/cp.
[EDITS below]
The exponent R/(1.5*cp) in the standard atmosphere derivation described above is
R/(1.5*cp) = 286.997/(1.5*1004.4) = α = 0.190493. Or, since cp = 7/2*R for an ideal diatomic gas, then R/(1.5*7/2*R) = α = 4/21 = 0.190476 .
Note from reference [1] that this same value of α is apparently a best fit to the data.
 |
| from O. G. Sorokhtin, G. V. Chilingarian, and N. O. Sorokhtin, Evolution of Earth and its Climate: Birth, Life and Death of Earth. Elsevier Science, 2010. |
So essentially we have the T vs P relation for the US Standard Atmosphere as
$$ T_1 = T_0 \cdot (\frac{p_1}{p_0})^{4/21} $$
with very precise resolution.
Martin Tribus recounted his discussion with Shannon [2] :
 |
| from M. Tribus, “An engineer looks at Bayes,” in Maximum-Entropy and Bayesian Methods in Science and Engineering, Springer, 1988. |
References
[1]
O. G. Sorokhtin, G. V. Chilingarian, and N. O. Sorokhtin, Evolution of Earth and its Climate: Birth, Life and Death of Earth. Elsevier Science, 2010.
[2]
M. Tribus, “An engineer looks at Bayes,” in Maximum-Entropy and Bayesian Methods in Science and Engineering, Springer, 1988, pp. 31–52.
[UPDATE]
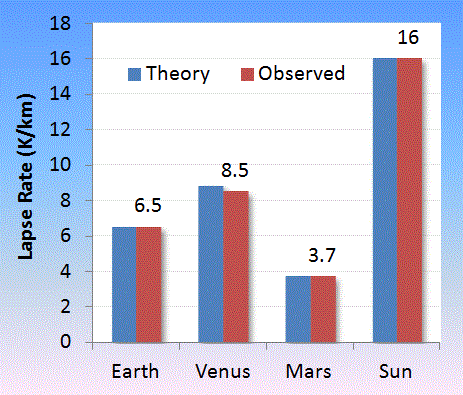
The lapse rate of temperature with altitude (i.e. gradient) is a characteristic that is easily measured for various advective planetary atmospheres.
If we refer to the polytropic factor 4/21 by f then the lapse rate
$$ LR = f \cdot g \cdot MW / R $$
where g is the acceleration due to gravity on a planet, and MW is the average molar molecular weight of the atmospheric gas composition on the planet. For the planets, Earth, Venus, Mars and the sun, the value of gravity and molecular weight are well characterized, with lapse rates documented in the references below.
 |
| Observed lapse rate gathered for Mars [3,4], Venus [5,6,7], Sun [8]. Venus seems to have the greatest variability with altitude |
| Object | Theory | Observed | MW | g |
| Earth | 6.506 | 6.5 | 28.96 | 9.807 |
| Venus | 8.827 | 8.5 ref [5] | 43.44 | 8.87 |
| Mars | 3.703 | 3.7 ref [4] | 43.56 | 3.711 |
| Sun | 16.01 | 16 ref [8] | 2.55 | 274.0 |
This change in humidity will cause a subtle change in lapse rate with global warming. As the relative humidity goes up with average temperature, the lapse rate will slightly decline, as water vapor is less dense than either molecular oxygen and nitrogen. So this means that an increase in temperature at the top of the atmosphere due to excess GHG will be slightly compensated by a change in tropospheric height, i.e. that point where the barometric depth is equal to the optical depth. What magnitude of change this will make on surface temperature is worthy of further thought, but as has been known since Manabe, the shift toward heating is as shown in the figure below. Note how the profile shifts right (warmer) with additional greenhouse gases.
 |
| Change in lapse rate with atmospheric composition is subtle. The larger effect is in radiative trapping of heat thus leading to an overall temperature rise. Taken from [9] |
The temperature of the earth is ultimately governed by the radiative physics of the greenhouse gases and the general application of Planck''s law. Based on how the other planets behave (and even the sun) the thermodynamic aspects seem more set in stone.
Lapse Rate References
[3]
R. Cess, V. Ramanathan, and T. Owen, “The Martian paleoclimate and enhanced atmospheric carbon dioxide,” Icarus, vol. 41, no. 1, pp. 159–165, 1980.
[4]
C. Fenselau, R. Caprioli, A. Nier, W. Hanson, A. Seiff, M. Mcelroy, N. Spencer, R. Duckett, T. Knight, and W. Cook, “Mass spectrometry in the exploration of Mars,” Journal of mass spectrometry, vol. 38, no. 1, pp. 1–10, 2003.
[5]
E. Palomba, “Venus surface properties from the analysis of the spectral slope@ 1.03-1.04 microns,” 2008.
[6]
A. Sinclair, J. P. Basart, D. Buhl, W. Gale, and M. Liwshitz, “Preliminary results of interferometric observations of Venus at 11.1-cm wavelength,” Radio Science, vol. 5, no. 2, pp. 347–354, 1970.
[7]
G. Fjeldbo, A. J. Kliore, and V. R. Eshleman, “The neutral atmosphere of Venus as studied with the Mariner V radio occultation experiments,” The Astronomical Journal, vol. 76, p. 123, 1971.
[8]
M. Molodenskii and L. Solov’ev, “Theory of equilibrium sunspots,” Astronomy Reports, vol. 37, pp. 83–87, 1993.
[9]
D. L. Hartmann, Global Physical Climatology. Elsevier Science, 1994.
[FINAL UPDATE]
CO2 is a polyatomic molecule and so (neglecting the vibrational modes) has 6 degrees of freedom (3 translation and 3 rotational) instead of the 5 (3 translational +2 rotational) of N2 and O2 in the gas phase. Understanding that, we can adjust the polytropic factor from f = (1+5/2)*(3/2)=21/4=5.25 to f = (1+6/2)*3/2=6 for planets such as Venus and Mars.
Accessing more detailed atmospheric profiles of Venus, we can test the following thermo models for f=6, where T0 and P0 are the surface temperature and pressure.
Lapse Rate
$$ T_1 = T_0 \cdot (1 - z/(f z_0)) $$
Barometric Formula
$$ p_1 = p_0 \cdot (1 - z/(f z_0))^f $$
with
$$ z_0 = \frac{R T_0}{MW g} $$
P-T Curves
$$ p_1 = p_0 \cdot (\frac{T_1}{T_0})^f $$
The lapse rate perhaps can be best understood by the following differential formulation
$$ \Delta E = m g \Delta z + c_p \Delta T $$
If 1/3 of the gravitational energy term is lost as convective kinetic energy, and cp=4R then
$$ \Delta E = 1/3 m g \Delta z = m g \Delta z + 4 R \Delta T $$
and this allows 2/3 of the gravitational energy to go through a quasi-adiabatic transition.
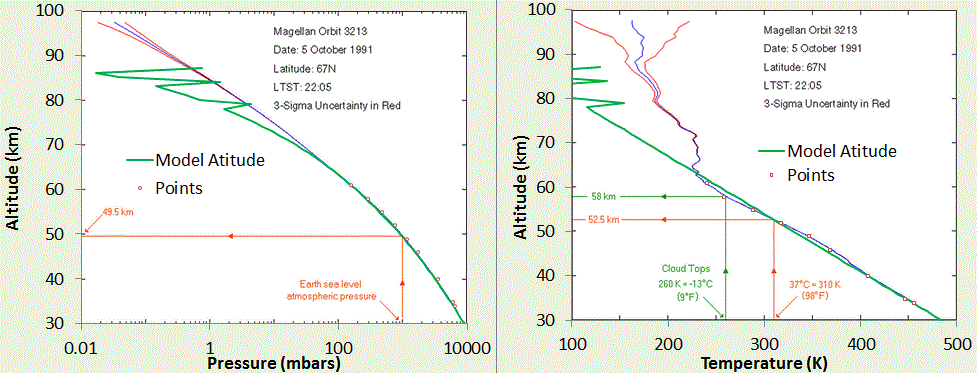
Whether this process describes precisely what happens (see Added Note in the first part of this post), it accurately matches the standard atmospheric profiles of Venus and Earth. It also follows Mars well, but the variability is greater on Mars, as can be see seen in the figures below. The CO2-laden atmosphere of Mars is thin so the temperature varies quickly from day to night, and the polytropic profile is constantly adjusting itself to match the solar conditions.
 |
| Venus has a lower atmospheric lapse rate that is more uniform, while Mars shows higher fluctuations on top of the mean slope. From http://www.lpl.arizona.edu/~showman/climate/venus-mars-pdflatex.pdf |
 |
| The Earth is described by the "Standard Atmosphere" polytropic profile which is shallower than the adiabatic. |
 |
| Data from the Russian Venera probes to Venus, with model overlaid. Adapted from
M. I. A. Marov and D. H. Grinspoon, The planet Venus. Yale University Press, 1998.
|
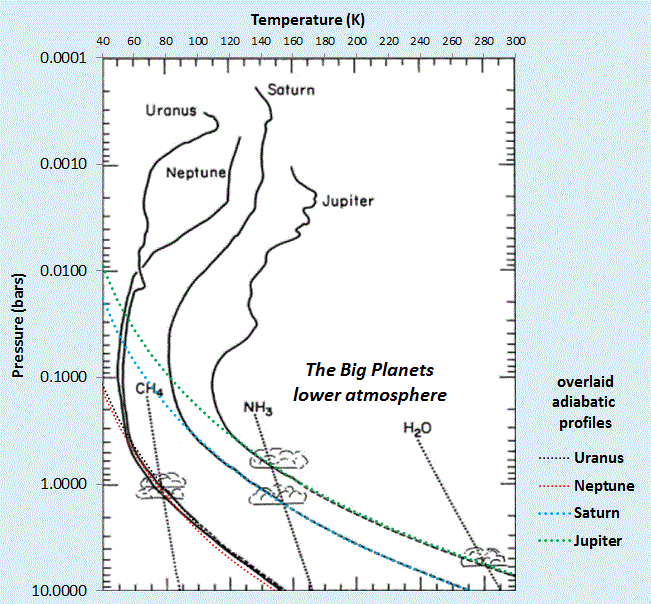
Final Caveat: Not all planets follow this polytropic quasi-adiabatic profile. The "big planets" of our solar system seem to follow the dry adiabatic very well at low atmospheric altitudes, see figure below. All of these consist mainly of H2 and a scattering of Helium (mono-atomic gas with Cp=5/2R) and so are slightly below 7/2R for a value of cp. Convective losses don't seem to play a role on these planets, in contrast to the sun, which is special in that the radiative temperature gradient can easily exceed the adiabatic lapse rate. In this case, the sun's atmosphere becomes collectively unstable and convective energy transport takes over (see T. I. Gombosi, Physics of the space environment. Springer, 1998, p.217).
 |
| The "Big Planets" of our solar system have lower atmospheres that follow the adiabatic profiles closely. Adapted from : L. A. McFadden, P. Weissman, and T. Johnson, Encyclopedia of the Solar System. Elsevier Science, 2006. |


No comments:
Post a Comment