The oil company Total S.A. also has an accounting of yearly discoveries. I overlaid their data with Laherrere's data in the figure below:
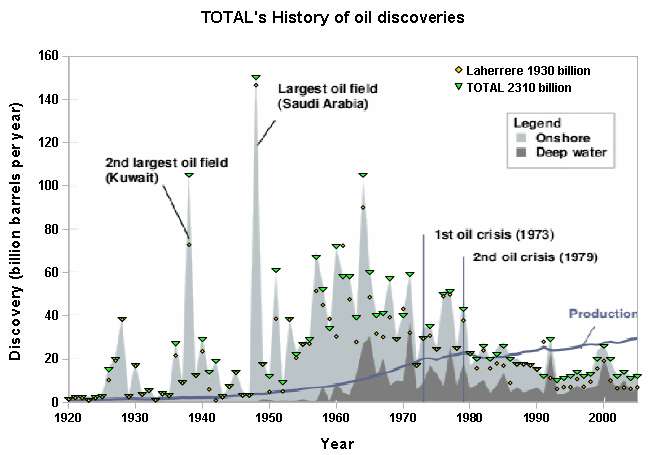
Total must do a bit of a different backdating because their data is consistently above Laherrere's for the majority of the years. As of about 2005, their cumulative is at 2310 GB while Laherrere is at 1930 GB.
This leads to the following asymptotic graph for cumulative oil according to the Dispersive Discovery model. In this case I assigned a URR of 2800 GB to the model, with a model value of 2450 GB as of 2005. In other words, the Total discovery data may hit an asymptote of 2800 GB, which may be a bit generous:

This is really for comparative purposes as I next plotted what Laherrere's discovery data looks like against the same model.
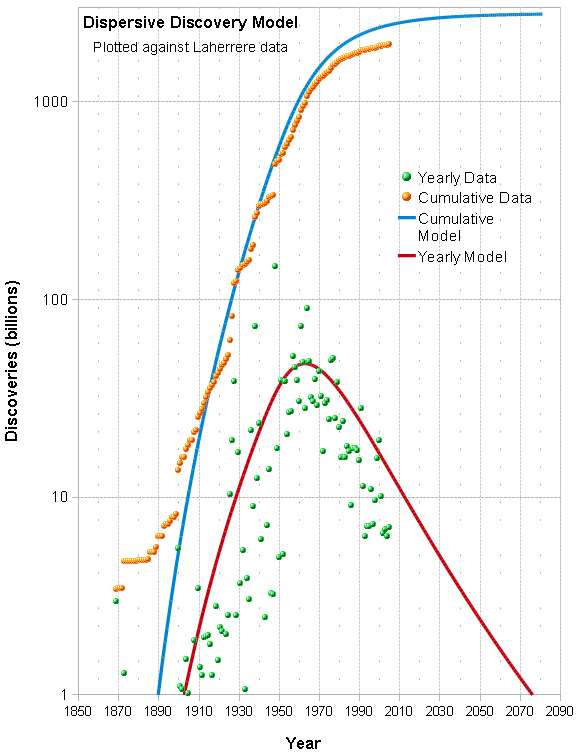
You can see that Laherrere's data likely won't hit that asymptote.
Discovery data for crude oil is hard to come by. Perhaps Laherrere is using 2P probabilities and Total is applying possible reserve growth so that it is >2P? Or perhaps Total is using barrels of oil equivalent (BOE) to inflate the numbers (which Shell oil does)? In the greater scheme of things, does this really matter?
The following chart is the Shock Model applied to the Total discovery data, whereby I tried to follow the historical crude oil (not All Liquids) production rates by varying the extraction rate until the year 2000, then I kept the extraction rate constant at about 3.1% of reserves. This is lower than the currently accepted 4% to 5% extraction rate from reserves.
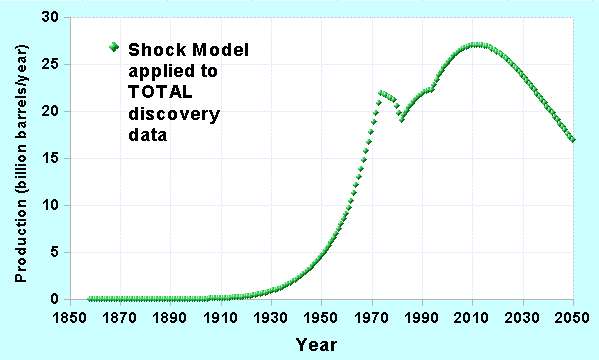
If Total does use BOE maybe this should actually fit an All Liquids curve, in which case the extraction rates would need to get increased to match the higher levels of All Liquids production.
Bottom line is that the peak plateau might extend for a couple of years and we will have a fatter decline tail if we believe the Total numbers. If it is an All Liquids discovery model, then it is a wash. As if everyone didn't know this by now, peak oil is not about the cumulative, it is about the extractive flow rates, and this is a good example of that.
In general, the URR is incrementally getting pushed up with time. Laherrere had used 2000 GB for a crude oil URR for some time (see this curve from 2005) and now likely because of the deep water oil it is at 2200 GB.
As for going through the trouble of evaluating the Gulf Of Mexico data, that is just noise on the overall curve IMO. It's getting to the point that we have enough historical data that global predictions for crude oil are really starting to stabilize. And the Dispersive Discovery model will anticipate any future discoveries. The longer we wait, the closer all the estimates will start to converge, and any new data will have little effect on the projected asymptotic cumulative.
The following is a curve that takes the Total S.A. discovery data and extrapolates the future discoveries with a dispersive discovery model. The final discovery URR is 2700 billion barrels, which is quite a bit higher than the one Laherrere plots. This is higher because I am making the assumption that Total S.A. is including backdated NGPL and other liquids along with the crude oil. Which means I had to fit against the production data that also used these liquids.
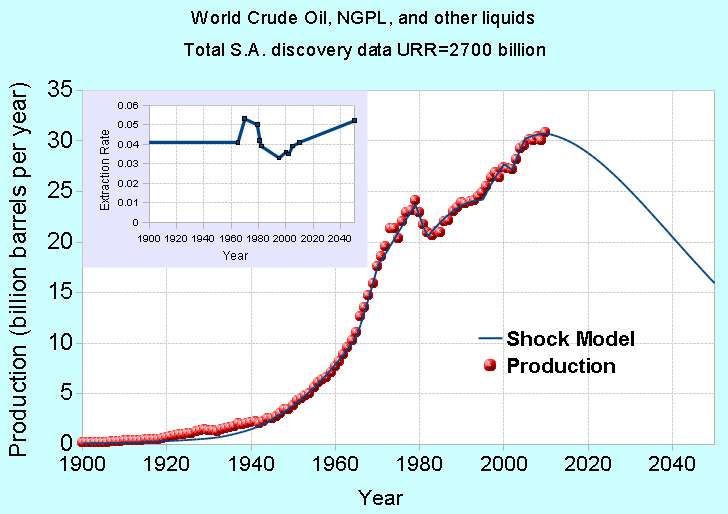
To model the perturbations in production levels, which is necessary to accumulate the reserves properly, I used the Oil Shock Model. In the inset, you can see the changes in extraction rate that occurred over the years. The extraction rate is essentially the same as the Production/Reserve ratio. Notice that the extraction rate was steady until the 1960's at which it ramped up. It started to level off and drop down during the 1970's oil crisis and didn't really start to rise again until the 1990's. I am extrapolating the extraction rate from today to match the peak extraction rate of the 1960's by the year 2050.
This is largely a descriptive working model, which essentially reflects the data that Total S.A. is providing and then reflecting that in terms of what we are seeing in the production numbers. The current plateau could be extended if we try to extract even faster (as in Rockman's words "PO is about oil flow rate") or we can start including other types of fuels to the mix. This latter will happen if the EIA and IEA add biofuels and other sources to the yearly production.
The bottom-line is that it is hard to come up with any scenarios, based on the data that Total and IHS supplies , that can extend this plateau the way that Total suggests it will, peak to 2020. That is what is maddening about this whole business and you wonder why drivel such as what Yergin continues to pump out gets published.
No comments:
Post a Comment