Rapid changes in CO2 levels track with global temperatures, with a variance reduction of 30% if d[CO2] derivatives are included in the model. This increase in temperature is not caused by the temperature of the introduced CO2, but is likely due to a reduced capacity for the biosphere to take-up the excess CO2.
This kind of modeling is very easy if you have any experience with engineering controls development. The model is of the type called Proportional-Derivative, and it essentially models a first-order equation
$$\Delta T = k[CO_2] + B \frac{d[CO_2]}{dt}$$
The key initial filter you have to apply is to average the Mauna Loa CO2 data over an entire year. This gets rid of the seasonal changes and the results just pop out.
The numbers I used in the fit are B=1.1 and k=0.0062. The units are months. The B coefficient is large because the CO2 impulse response has got that steep downslope which then tails off:
$$ d[CO_2] \sim \frac{1}{\sqrt{t}}$$
Is this a demonstration of causality, +CO2 => +Temperature?
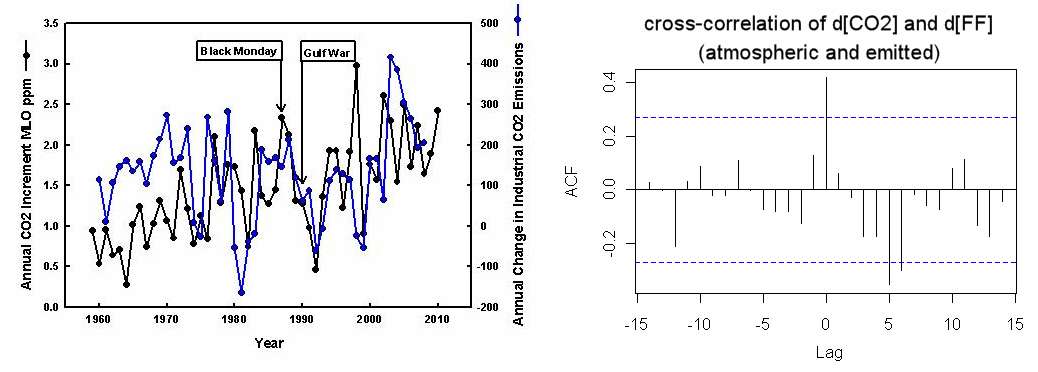
If another causal chain supports the change in CO2, then likely. We have fairly good records of fossil fuel (FF) emissions over the years. The cross-correlation of the yearly changes, d[CO2] and d[FF], show a zero-lag peak with a significant correlation (below right). The odds of this happening if the two time-series were randomized is about 1 out of 50.
Left chart from Detection of global economic fluctuations in the atmospheric co2 record. This is not as good a cross-correlation as the d[CO2] and dTemperature data -- look at year 1998 in particular, but the zero-lag correlation is clearly visible in the chart..
This is the likely causality chain:
$$d[FF] \longrightarrow d[CO_2] \longrightarrow dTemperature$$
If it was the other way, an increase in temperature would have to lead to both CO2 and carbon emission increases independently. CO2 could happen because of outgassing feedbacks (CO2 in oceans is actually increasing despite the outgassing), but I find it hard to believe that the world economy would increase FF emissions as a result of a warmer climate.
What happens if there is a temperature forcing CO2 ?
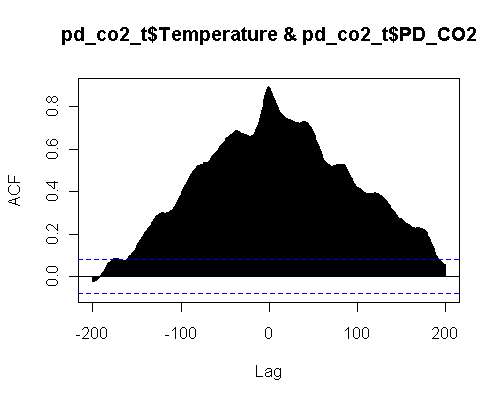
With the PD model in place the of d[CO2] against Temperature cross-correlation looks like the following:

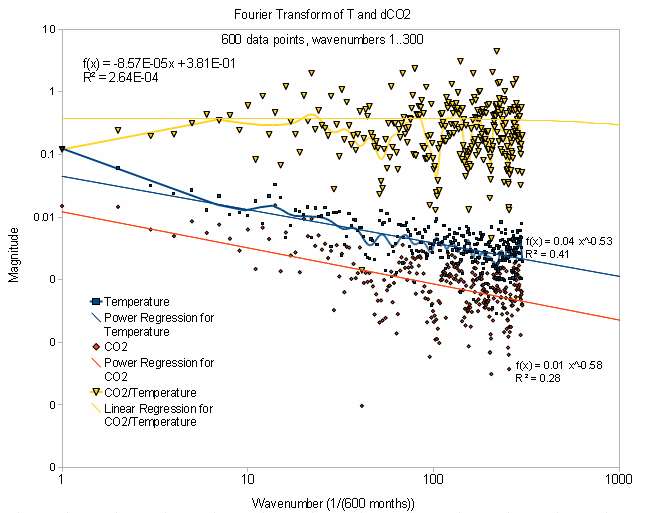
The Fourier Transform set looks like the following:

This shows the two curves have the same slope in spectrum and just a scale shift. The upper curve is the ratio between the two curves and is essentially level.
The cross-correlation has zero lag and a strong correlation of 0.9. The model again is
$$ \Delta T = k[CO_2] + B \frac{d[CO_2]}{dt}$$
The first term is a Proportional term and the second is the Derivative term. I chose the coefficients to minimize the variance between the measured Temperature data and the model for [CO2]. In engineering this is a common formulation for a family of feedback control algorithms called PID control (the I stands for integral). The question is what is controlling what.
When I was working with vacuum deposition systems we used PID controllers to control the heat of our furnaces. The difference is that in that situation, the roles are reversed, with the process variable being a temperature reading off a thermocouple and the forcing function is power supplied to a heating coil as a PID combination of T. So it is intuitive for me to immediately think that the [CO2] is the error signal, yet that gives a very strong derivative factor which essentially amplifies the effect. The only way to get a damping factor is by assuming that Temperature is the error signal and then we use a Proportional and an Integral term to model the [CO2] response. Which would then give a similar form and likely an equally good fit.
It is really a question of causality, and the controls community have a couple of terms for this. There is the aspect of Controllability and that of Observability (due to Kalman).
Controllability: In order to be able to do whatever we (Nature) want
with the given dynamic system under control input, the system must be controllable.
Observability: In order to see what is going on inside the system under observation, the system must be observable.
So it gets to the issue of two points of view:
1. The people that think that CO2 is driving the temperature changes have to assume that nature is executing a Proportional/Derivative Controller on observing the [CO2] concentration over time.
2. The people that think that temperature is driving the CO2 changes have to assume that nature is executing a Proportional/Integral Controller on observing the temperature change over time, and the CO2 is simply a side effect.
What people miss is that it can be potentially a combination of the two effects.
Nothing says that we can’t model something more sophisticated like this:
$$ c \Delta T + M \int {\Delta T}dt = k[CO_2] + B \frac{d[CO_2]}{dt}$$
The Laplace transfer function Temperature/CO2 for this is:
$$ \frac {s(k + B s)}{c s + M} $$
Because of the s in the numerator, the derivative is still dominating but the other terms can modulate the effect.
This blog post did the analysis a while ago, the image below is fascinating because the overlay between the dCO2 and Temperature anomaly matches to the point that the noise even looks similar . This doesn't go back to 1960.

If CO2 does follow Temperature, due to the Causius-Clapeyron and the Arrhenius rate law, a positive feedback will occur -- as the released CO2 will provide more GHG which will then potentially increase temperature further. It is a matter of quantifying the effect. It may be subtle or it may be strong.
From the best cross-correlation fit, the perturbation is either around (1) 3.5 ppm change per degree change in a year or (2) 0.3 degree change per ppm change in a year.
(1) makes sense as a Temperature forcing effect as the magnitude doesn’t seem too outrageous and would work as a perturbation playing a minor effect on the 100 ppm change in CO2 that we have observed in the last 100 years.
(2) seems very strong in the other direction as a CO2 forcing effect. You can understand this if we simply made a 100 ppm change in CO2, then we would see a 30 degree change in temperature, which is pretty ridiculous, unless this is a real quick transient effect as the CO2 quickly disperses to generate less of a GHG effect.
Perhaps this explains why the dCO2 versus Temperature data has been largely ignored. Even though the evidence is pretty compelling, it really doesn’t further the argument on either side. On the one side interpretation #1 is pretty small and on the other side interpretation #2 is too large, so #1 may be operational.
One thing I do think this helps with is providing a good proxy for differential temperature measurements. There is a baseline increase of Temperature (and of CO2), and accurate dCO2 measurements can predict at least some of the changes we will see beyond this baseline.
Also, and this is far out, but if #2 is indeed operational, it may give credence to the theory that that we may be seeing the modulation of global temperatures the last 10 years because of a plateauing in oil production. We will no longer see huge excursions in fossil fuel use as it gets too valuable to squander, and so the big transient temperature changes from the baseline no longer occur. That is just a working hypothesis.
I still think that understanding the dCO2 against Temperature will aid in making sense of what is going on. As a piece in the jigsaw puzzle it seems very important although it manifests itself only as a second order effect on the overall trend in temperature. In summary, as a feedback term for Temperature driving CO2 this is pretty small but if we flip it and say it is 3.3 degrees change for every ppm change of CO2 in a month, it looks very significant. I think that order of magnitude effect more than anything else is what is troubling.
One more plot of the alignment. For this one, the periodic portion of the d[CO2] was removed by incorporating a sine wave with an extra harmonic and averaging that with a kernel function for the period. This is the Fourier analysis with t=time starting from the beginning of the year.
$$ 2.78 \cos(2 \pi t - \theta_1) + 0.8 \cos(4 \pi t - \theta_2) $$
$$ \theta_1 = 2 $$
$$ \theta_2 = -0.56 $$
phase shift in radians. The yearly kernel function is calculated from this awk function:
BEGIN {
I=0
}
{
n[I++] = $1
}
END {
Groups = int(I / 12)
## Kernel function
for(i=0; i<=12; i++) {
x = 0
for(j=0; j<Groups; j++) {
x += n[j*12+i]
}
G[i] = x/Groups
}
Scale = (G[12]-G[0])
for(i=0; i<=12; i++) {
Y[i] = (G[i]-G[0]) -i*Scale/12
}
for(j=0; j<Groups; j++) {
for(i=0; i<12; i++) {
Diff = n[j*12+i] - Y[i]
print Diff
}
}
}
This was then filtered with a 12 month moving average. It looks about the same as the original one from Wood For Trees, with the naive filter applied at the source, and it has the same shape for the cross-correlation. Here it is in any case; I think the fine structure is a bit more apparent(the data near the end points is noisy because I applied the moving average correctly).
How can the derivative of CO2 track the temperature so closely? My working theory assumes that new CO2 is the forcing function. An impulse of CO2 enters the atmosphere and it creates an impulse response function over time. Let's say the impulse response is a damped exponential and the atmospheric temperature responds quickly to this profile.
The CO2 measured at the Mauna Loa station takes some time to disperse over from the original source points. This implies that a smearing function would describe that dispersion, and we can model that as a convolution. The simplest convolution is an exponential with an exponential, as we just need to get the shape right. But what the convolution does is eliminate the strong early impulse response, and thus create a lagged response. As you can see from the Alpha plot below, the way we get the strong impulse back is to take the derivative. What this does is bring the CO2 signal above the sample-and-hold characteristic caused by the fat-tail. The lag disappears and the temperature anomaly now tracks the d[CO2] impulses.
If we believe that CO2 is a forcing function for Temperature, then this behavior must happen as well; the only question is whether the effect is strong enough to be observable.
If you realize that the noisy data below is what we started with, and we had to extract a non-seasonal signal from the green curve, one realizes that detecting that subtle a shift in magnitude is certainly possible.


No comments:
Post a Comment