
What is interesting in that GreatBear graphic is the progression of the permeability of the reservoirs. The permeability is going down by an order of magnitude for each new technology introduced. I don't understand all the intricacies of geology but I do understand the mathematics and physics of diffusion. See here.
What decreasing permeability means is that the production rates of oil are now becoming completely diffusion-limited. In other words, the flow of oil is essentially a random walk from the source to the destination. All these new technologies are doing is exploiting the capabilities of diffusion-limited capture. This is the bottom-of-the-barrel stuff, kind of like driving your car off of fumes, or keeping your maple syrup bottle upside down, to make a more intuitive analogy out of it. The Bakken rates are likely all diffusion limited and I will be willing to bet this based on some of the data from Mason.
James Mason 2012 paper
From Mason's data, the flow of oil out of a hydraulically fractured well appears to be controlled by diffusional dynamics. This is what an average Bakken well decline looks like if one uses Mason's charts.
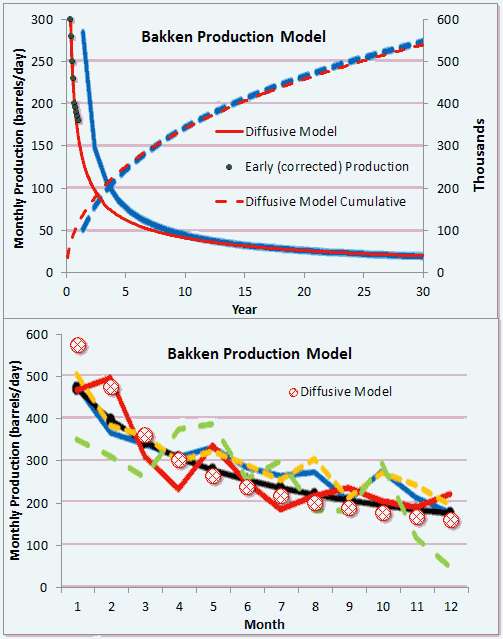
The cumulative is the important part of the curve I believe because he plotted the instantaneous production incorrectly (which I tried to correct with the black dots).
But then if we look at Brackett's analysis of Bakken (see below), I can better fit the average well to a hyperbolic decline model. A hyperbolic decline is an ensemble average of exponential declines of different rates, assuming maximum entropy in the distribution in rates (this works to describe lots of physical phenomena).

That conflicts with the diffusional model that better describes Mason's data.
Now, I believe it's possible that Brackett simply took the 1/e decline point on each well and then tried to extrapolate that to an average production. That's the easy way out and is definitely wrong as this will always approximate a hyerbolic decline; of course I can check this if I can get access to the 3,694 samples that Brackett says goes into his analysis.
Mason and Brackett can't both be right, as there are sufficient differences between diffusional flow decline and hyperbolic decline to impact projections. The former is steeper at first but has a fatter tail, whereas the latter will definitely decline more in the long term. Brackett says the average well will generate 250,000 barrels of oil while Mason shows twice that and still increasing.
Rune Likvern has a lot of the data that he painstakingly scraped from PDF files.
Likvern 1 | Likvern 2 (in Swedish)
There will be more data forthcoming in the next few years. We will see how it pans out.
Hi WHT,
ReplyDeleteI was attempting to use your model for diffusional flow to model Bakken Oil output.
It seems you used D0=0.0023 and P0 =2.6 million barrels. The point for one month is different than what you show on your graph, but otherwise I think I have reproduced the model correctly.
It was not immediately obvious why 2.6 million barrels was chosen for P0. Were you assuming a URR of 167 billion barrels and 64000 wells drilled (eventually)?
Thanks.
DC
Hi WHT,
ReplyDeleteI have used your dispersive difusion model to create a future scenario for Bakken output. Enjoy!
http://oilpeakclimate.blogspot.com/
DC
DC
ReplyDeleteThe early part is tricky because the production flow rates show a singularity at t=0. I recall taking the values at t=0.5 and t=1.5 months and using that as the average. I may have messed that up. Thanks for the pointer.
The 2.6 million came from Mason's curve, as a 2-parameter fit. It is akin to a creaming curve estimate.
Very cool analysis. It's just a matter of time before more numbers come out.
If you got 2.6 million barrels by fitting to the curve, was there some physical basis for D naught? Is the P naught akin to the resource drained by the well? In other words, does the P naught of 4.175 million barrels, based on an estimate of 167 Gb of oil resources and 40000 producing wells when saturation (as Mason uses the term) occurs, make sense? I am asking because I don't want to misuse your model and I am confident that your understanding of the underlying dispersive diffusion model is better than mine.
ReplyDeleteI understand the singularity at zero, it seemed to me that the values at one month were reasonable. When I average the .5 month and 1.5 month I get 712 barrels/ day for the first month with P0=2.6 million and d0=0.0023, closer to your plot on Mason's curve above.
My choice for D0 on my blog was based on what seemed fairly close to Mason's data while fitting the data from ND DMR.
Thanks.
DC
DC,
ReplyDeleteThe value of P0 is an estimate of the drainage volume, which is gleaned from the trajectory of the cumulative curve. Two parameters are fit, one for the mean diffusivity DO and one for the total volume P0.
The crucial part of this model is that diffusion has very long and fat tails, so the buildup is very gradual well along the curve. This has the effect of making the ultimate estimate perhaps larger than you would first intuit.
This happens due to the nature of pure random walk diffusion and the fact that there are no limits to how far material can diffuse over the course of time.
I am working on a model which bridges the gap between diffusive behavior and the so-called hyperbolic behavior. This involves applying a diffusion property that reverts to the mean and prevents unbounded excursions of a random walk. This is known as the Ornstein-Uhlenbeck process.
I will post something on this shortly and I think it is the true missing link between the two decline models. It will add another parameter into the mix, but it has huge implications for overall understanding of the dynamics.
The indications are that within the Ornstein-Uhlenbeck model, the diffusive component is strong initially, and then the hyperbolic decline sets in, which will effectively reduce P0 from the value determined from a purely diffusive model.
If we assume that the total resource can be estimated by R and that there is some maximum number of wells that can be drilled, which we might call N (this is due to technological and physical area limitations). Could we estimate P0 = R/N for the average well? If so we could use D0 for fitting the curve to the Data.
ReplyDeleteYour new model sounds interesting. Thanks.
Hi WHT,
ReplyDeleteI came across an interesting web page which discusses oil depletion, in case you have not already found it, I wanted to share it with you.
http://www.fekete.com/software/rta/media/webhelp/c-te-analysis.htm
DC